A fair, custom, and transparent price.
We spend time getting to know you, your business, and how we can be most helpful to your growing business. We fixed fee as much as possible and provide pricing ranges for custom work.
Cost Structure (it depends)
Determined by company size, growth goals, and existing organizational structure.
The first step is a modest audit to determine fit. After understanding your objectives, we offer these tailored plans:
Basic
Monthly subscription to an automated financial platform and dashboard:
Centralized and custom financial and marketing data to understand critical business metrics and turn them into actionable insights.
Maintain a daily view of all your data in one place to track KPIs and guide decisions.
Intermediate
+ Strategic CFO Advisory services:
Organizational structure—Building the foundation for scalability.
Capital providers—Key considerations for taking on debt & equity.
Levers & KPIS — Identifying the biggest levers and tracking the right KPIs.
Advanced
+ Month-end Data analysis and FP&A for:
Financial modeling
Contribution margin tracking
Plan vs. Actual
13 week cash flow
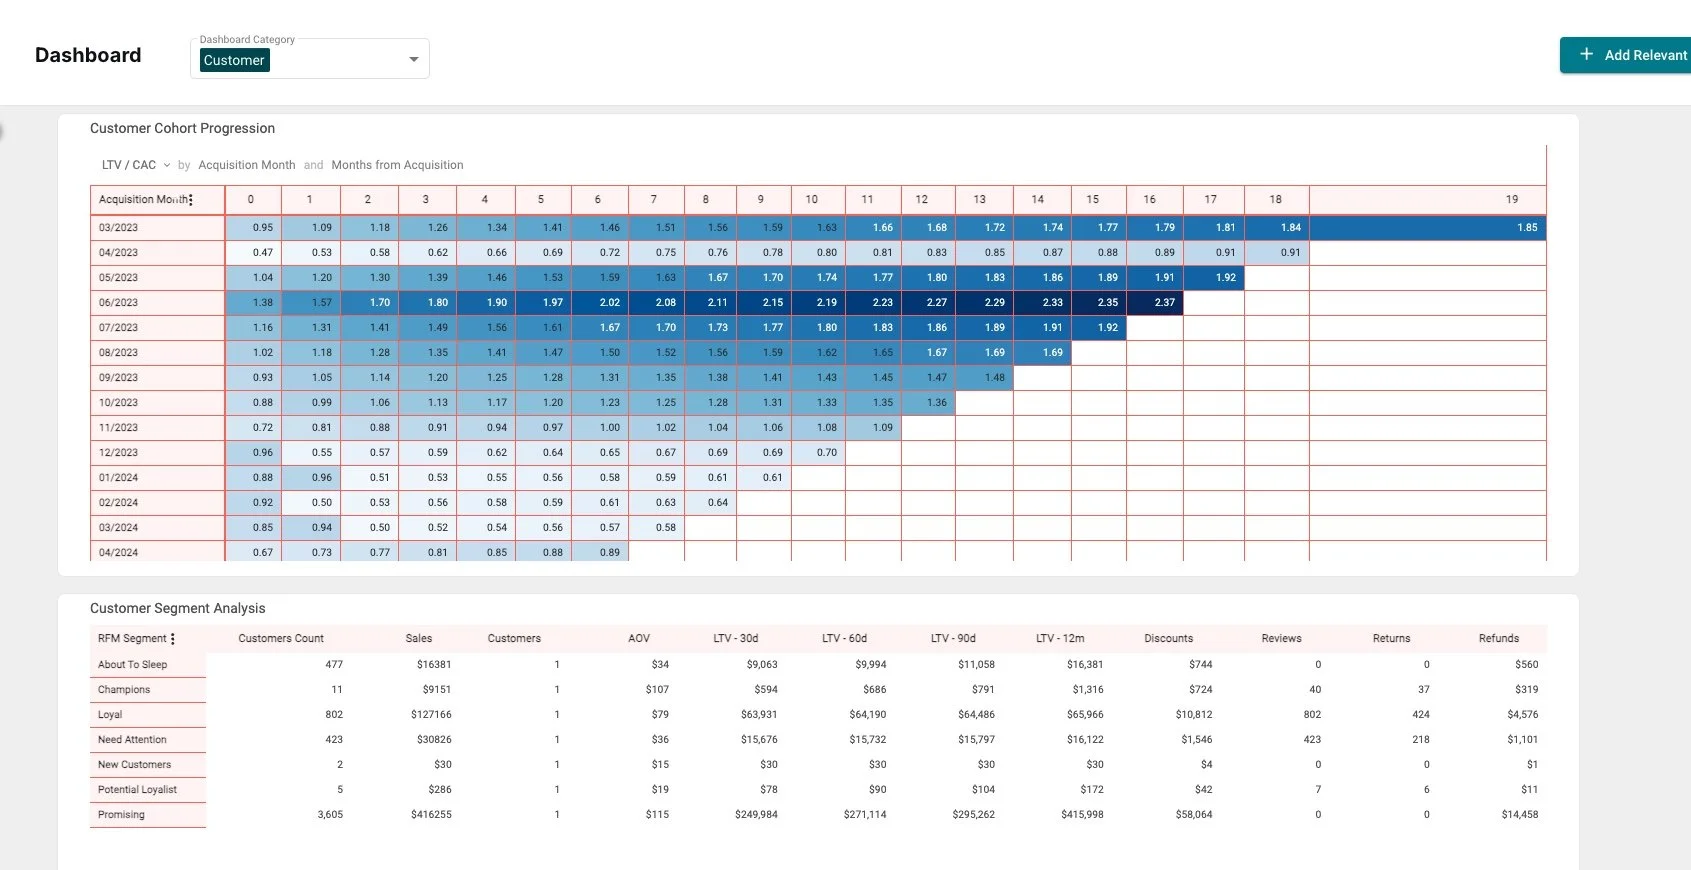
Cohort profitability analysis
Integrations
Save time and effort — we connect with many tools.
Shopify
•
Amazon
•
QuickBooks
•
•
•
Recharge
•
TikTok
•
Klaviyo
•
Shopify • Amazon • QuickBooks • Facebook • Google • Recharge • TikTok • Klaviyo •
Trusted Partners & Capital Providers


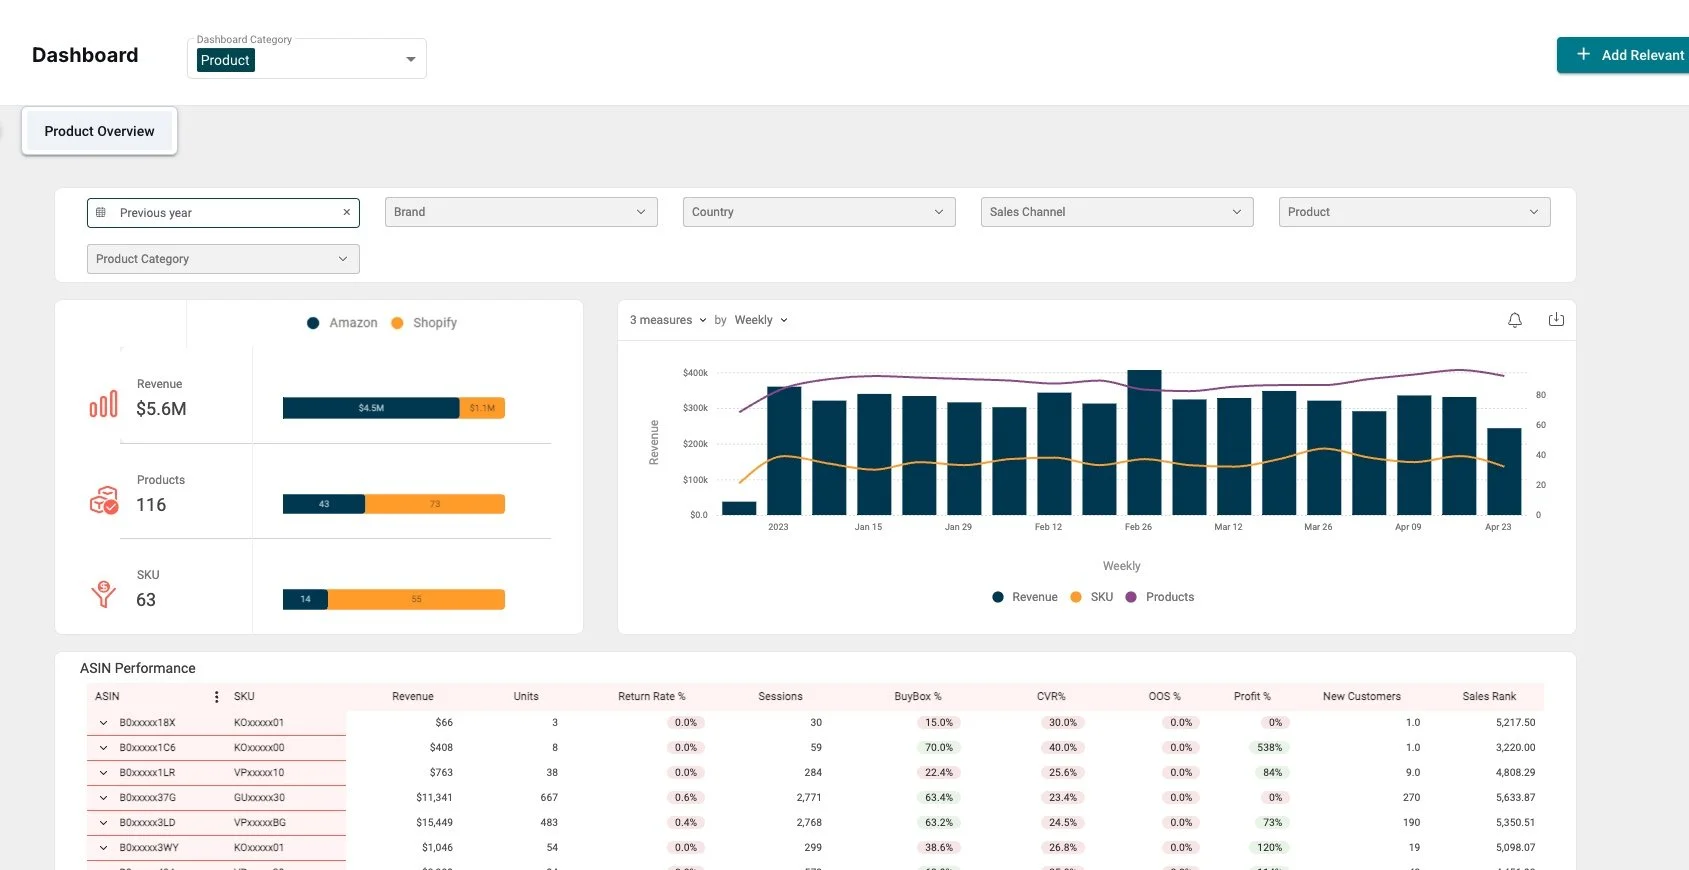
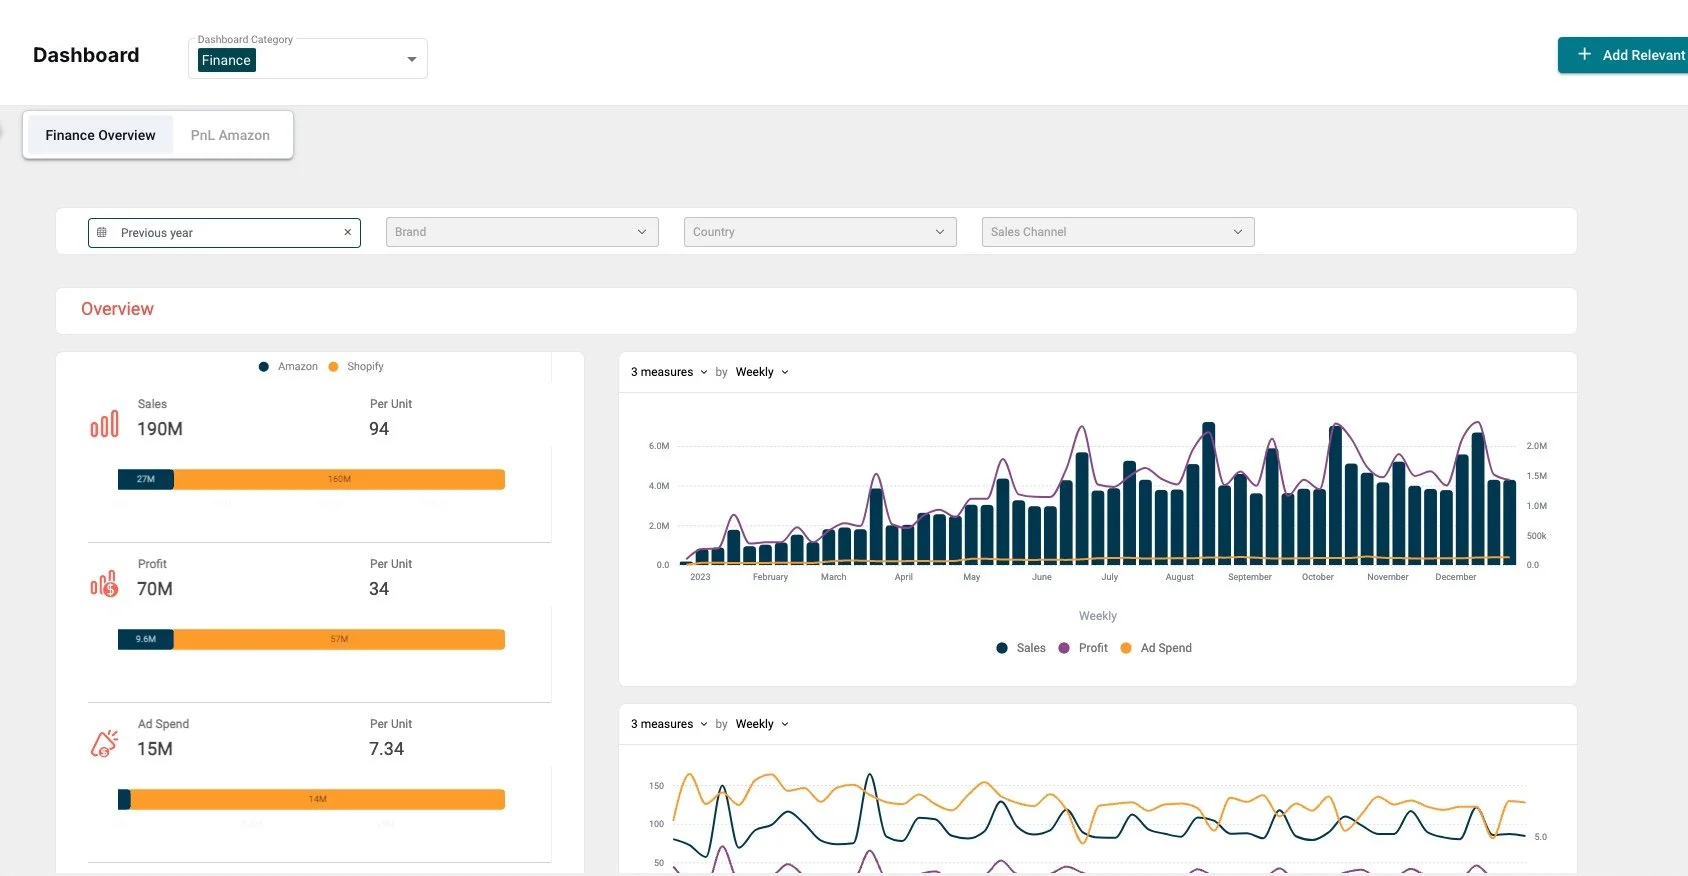
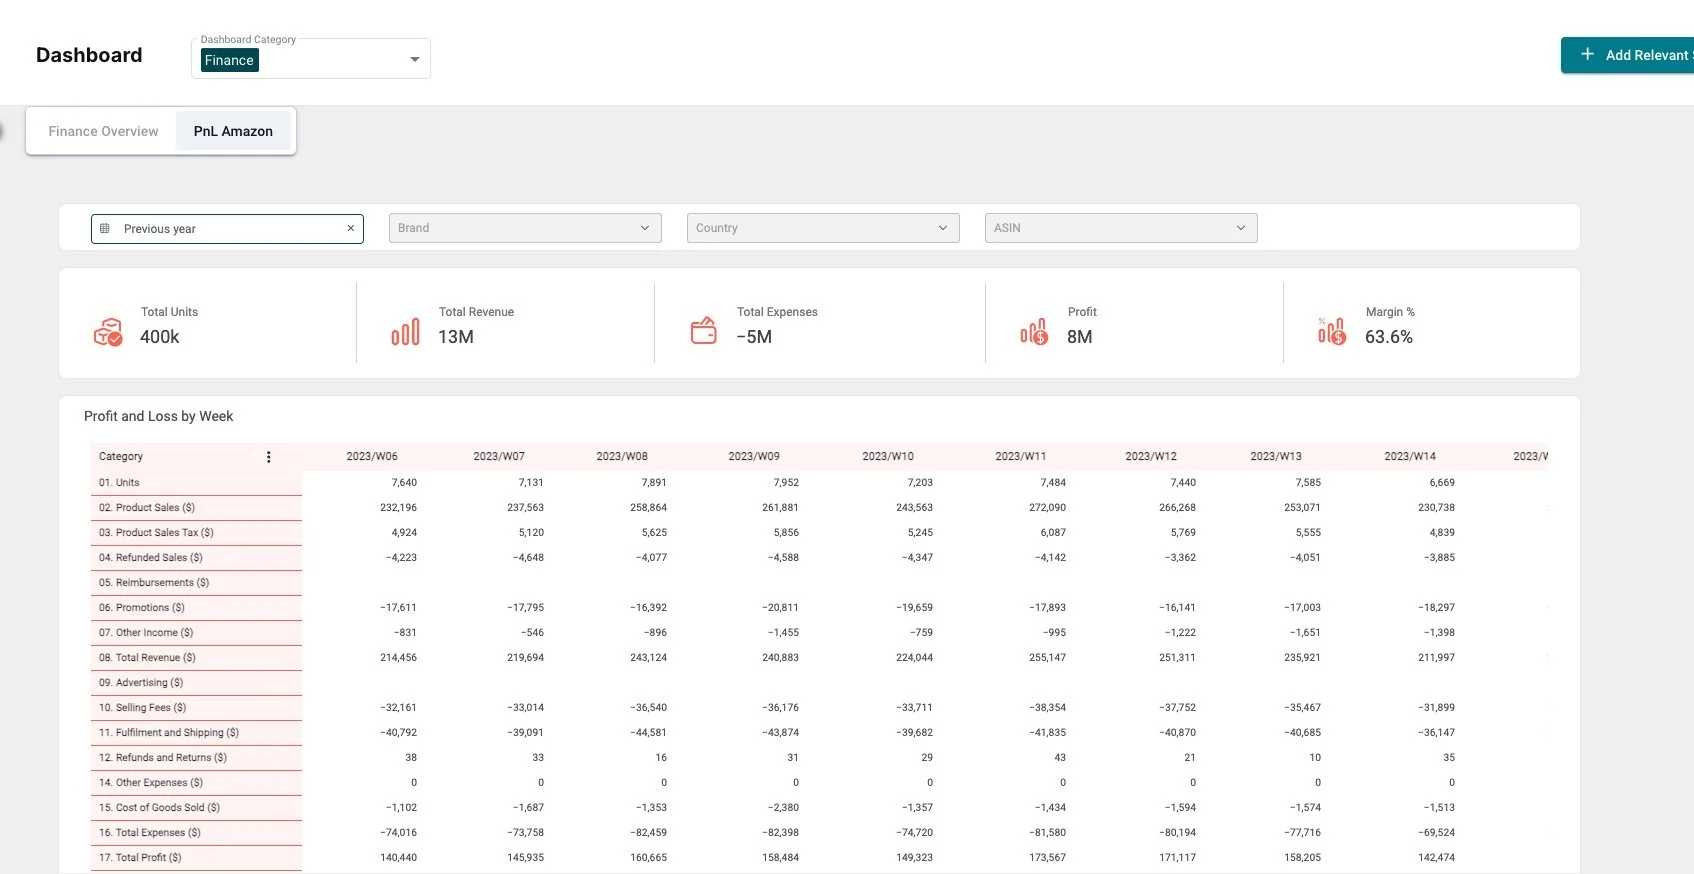
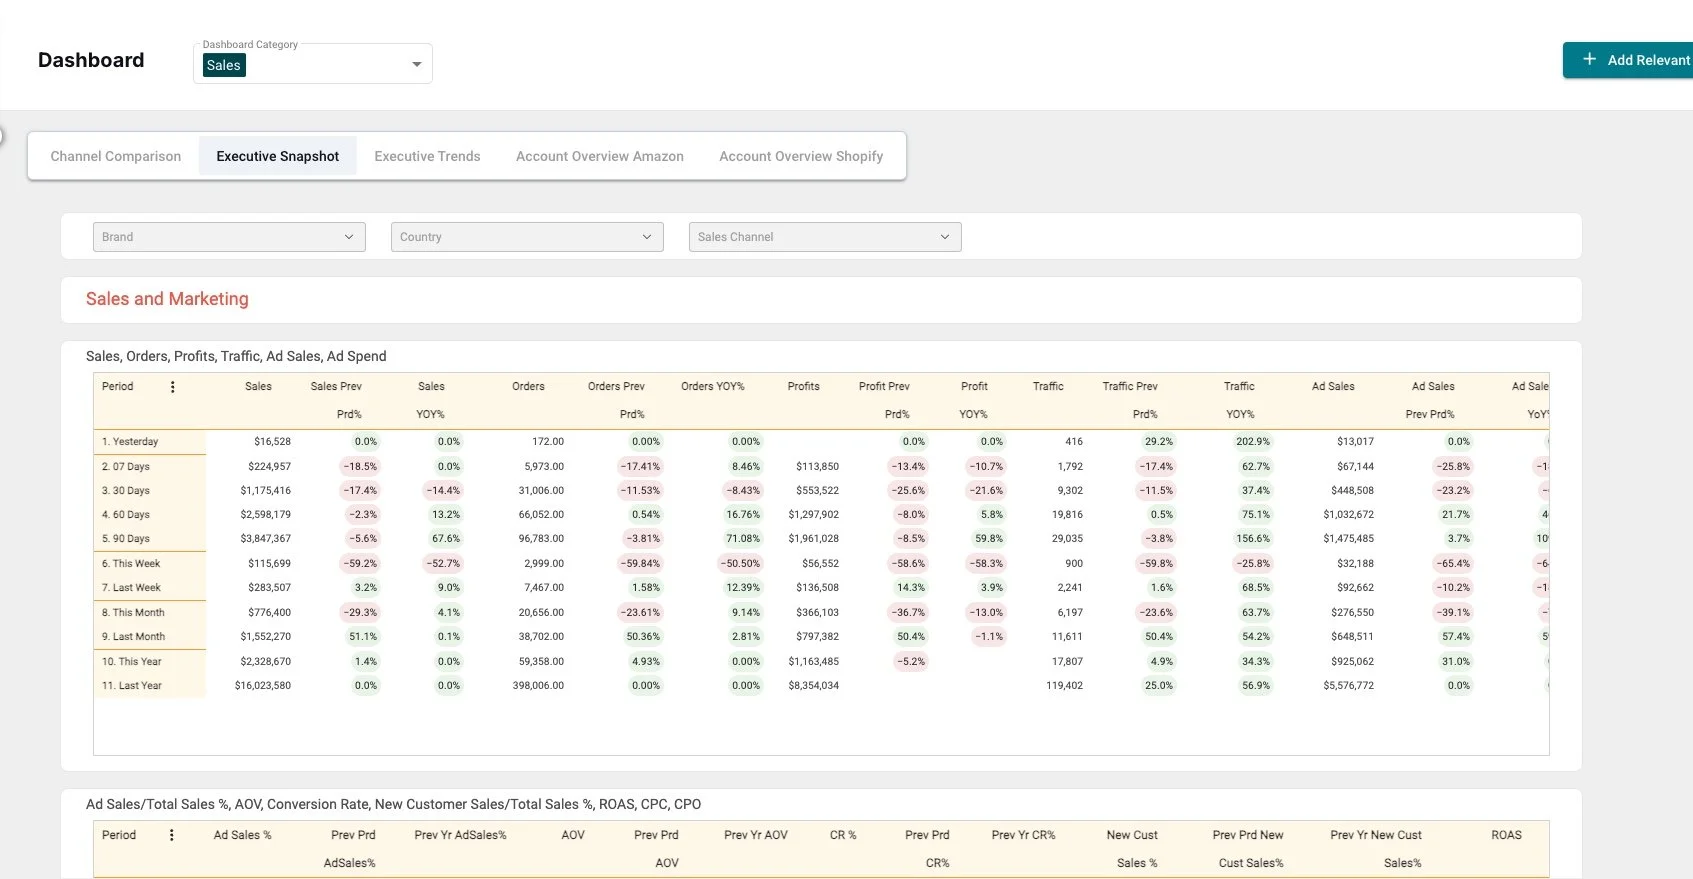
Platform & Dashboard Features
-
Combined Shopify and Amazon P&L
-
Amazon Specific P&L
-
Executive Snapshot
-
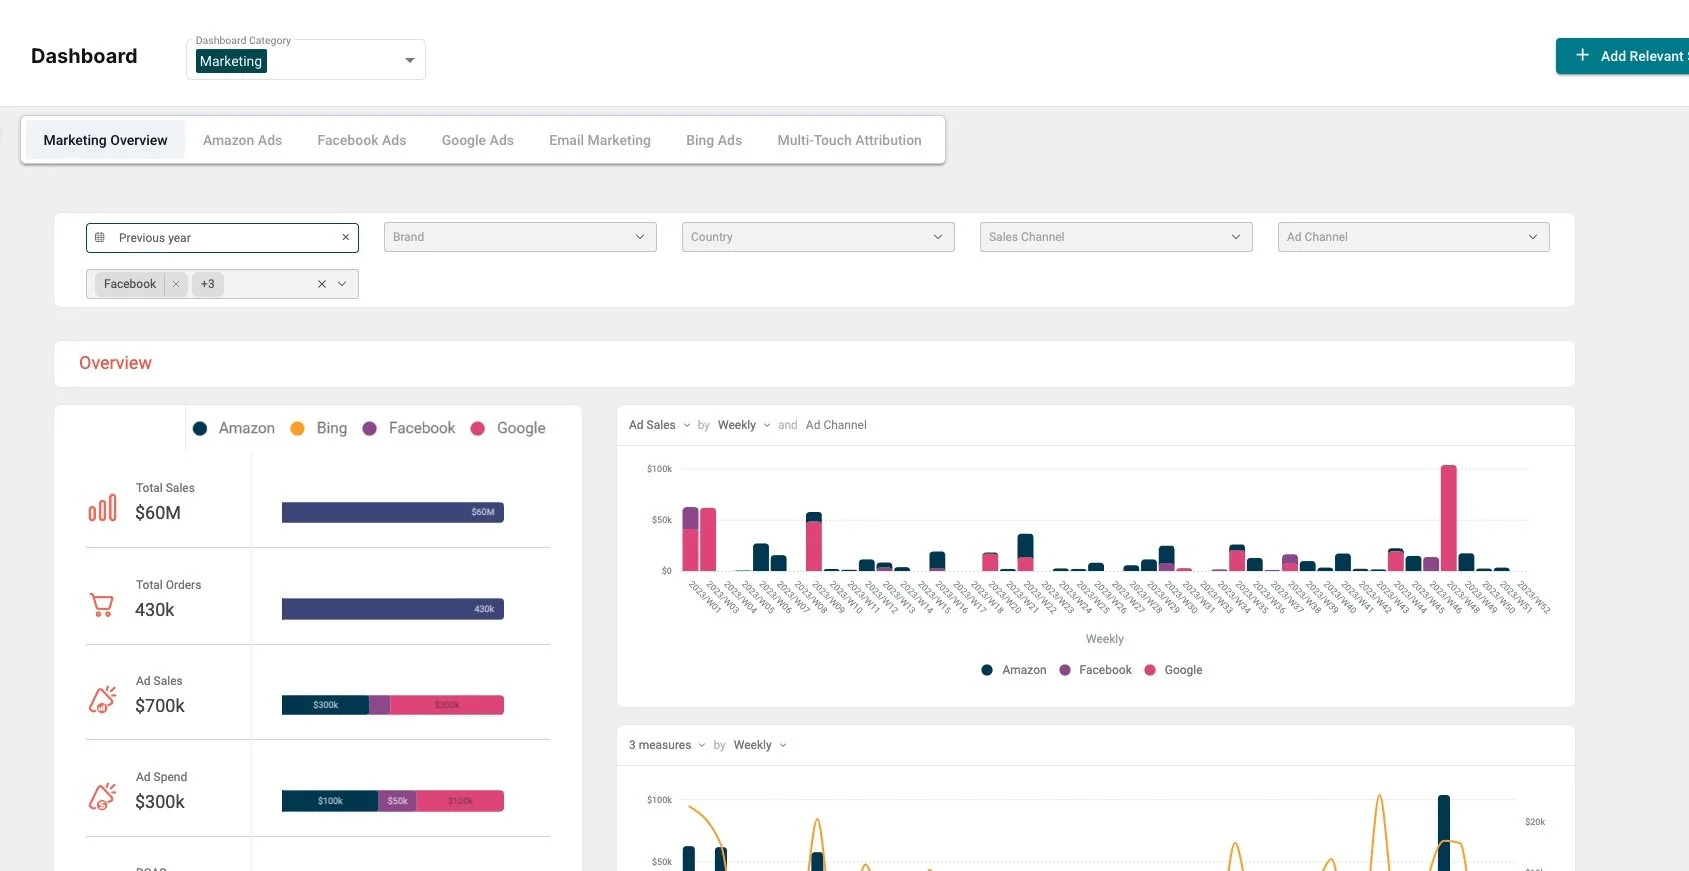
OmniChannel Marketing Dashboard
-
LTV / Customer Profitability
-
Product Contribution Margin Tracking